How is Analytics Important for E-commerce Business?
You can see customers come and go in a physical store and you know what they are looking for. You will be able to help them make the right choice face to face. This is the advantage of direct contact. The case is not the same with online stores. You might not even know if they visited your store.
One way to get insights on your online store visitors is the implementation of Website Analytics. If you are running an online store without analytics, then you are basically blind and you will have no idea what’s going on with your website.
With the right tools, you can keep a track of your customers, visiting prospects, their interests and much more.
Your web traffic is divided into 4 categories:
- Search — The one that comes from search engines like Google, Yahoo and Bing.
- Referral — Traffic that comes directly from a link on a different website.
- Campaign — The traffic that has been tagged by the marketer. It could be email, Social Media, etc
- Direct — Traffic which doesn’t have a known source.
Any data you collect must be measured and analysed. This will help in feeding the user with the right information which can be converted to an actionable insight over a period of time.
*Shoppers’ Journey*
Your main revenue drivers are your shoppers. What’s more important to them on your site is the user experience. With web analytics, you can track a shoppers’ journey, understand their behavior, analyze them and feed them with the right product.
Here’s the shoppers’ journey and the metrics that correspond to each step of the journey:
Awareness — Brand Impressions
Interest — Clicks
Consideration — Customer Database Records
Purchase — Conversion
Retention — Lifetime Value
Advocacy — Referrals
*Awareness*
To understand your shopper journey better it’s very important you collect enough data. Some of the common and very important events to collect are:
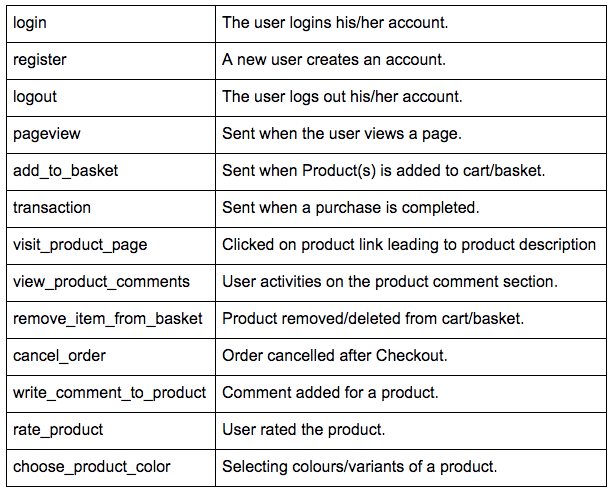
etc. etc.
Now that you have collected all these events, it’s time to analyze.
*Users’ shopping behavior*
With analytics you get a complete view of the users’ shopping behavior on your online store. Analytics provide you with all the data, such as how many people visit your online store daily, how many people make purchases, and how many left just before the transaction. Collect information such as traffic source, location, most popular products, high selling, low selling.
*Analysing the shopping behaviours*
Once you gather enough information on users’ behaviour, you need to slice and dice the data in a way that are readable by pretty much everyone. This will help different teams to understand where there is enough improvement, what needs changes, what needs modification. And the responsible teams can take necessary actions.
*Keep an eye on marketing efforts*
It’s very important to tag all the marketing campaigns to understand the performance of your campaign better. It’s always a good practise to manually tag your marketing campaigns. This way you can segment your results and understand which of your campaigns need the push.
Let’s say you publish two posts to any of the social media platforms. The first is a regular post about your company and it links to a blog post on your site. The second is a special post announcing a new promotion. If you aren’t manually tagging these links, then all the traffic from both posts will appear as referral traffic with the respective social media being the referrer. It would be more useful to tag each of these posts as different campaigns.
So where does Rakam fit in when there are tons of analytics solution providers out there?
Firstly, Rakam is a fully customizable open source platform.
One of the major problems companies face with tools like Google Analytics, Mixpanel, and others is that you will have no control over the user data. With the pre-defined features, you are sometimes stuck with no flexibility to create custom reports.
Let’s take Google Analytics as an example; it’s developed as a generic analytics solution but this is not the way it works in reality. The metrics such as bounce rate, session duration is different in a blog compared to an e-commerce website. You need to tune Google Analytics in order to be able to use it in an efficient way. However; even though you can tune it, unless you’re using premium version of analytics (starts from $150K per month) you do not have access to user level data so you won’t be able to create custom reports that are important for your business. Here are some of the examples:
- *Creating metrics for a specific user group of your application.* For example; bounce rate of people who abandoned their items in their basket etc.)
- *The inability to create custom funnel and retention reports.* For example you want to find out users who did 3 steps in a funnel but you want to restrict the funnel steps in a single session. If they’re dropped from the session, the system should not count the users as converted.
- *Joining user attribution data with your event data.* For example you want to find out the average age of your users who added a specific product to their basket. Unless you add their age as an event property in data collection, you won’t be able to do it.
In comparison with Mixpanel, it has high level features such as funnel, retention and segmentation. In addition to these high level features, they have JQL (add mixpanel jql documentation link to here) for custom reporting. It’s basically a Javascript DSL that allows you to run Javascript code in their infrastructure, you fetch, transform and aggregate your data using their DSL, named as JQL. The main problem is that it requires you to learn Javascript and their query language JQL which is specific to their system. You need to train your data analysts to learn them all before creating your first report. On the other hand, SQL is a well-defined and well-known query language for data-sets.Nowadays, even the marketing people started to learn SQL and most of the data analysts already know SQL.
With Rakam, all the event-data is transformed into the tables and columns so all you need to do is to write SQL code for your custom reports. It supports ANSI-SQL 2011 standard so you have access to CTEs, WINDOW functions and many other analytics features in SQL. For big-data, we also provide approximate functions in order to make your queries efficient.
With Rakam you have full control over your data and have access to similar reports that you’re familiar with such as funnel, retention and segmentation. Additionally, you have freedom to slice & dice and setup your dashboard and custom reports as you want without any restriction using SQL.
Here’s a view into rakam (We call it “The Cockpit”):
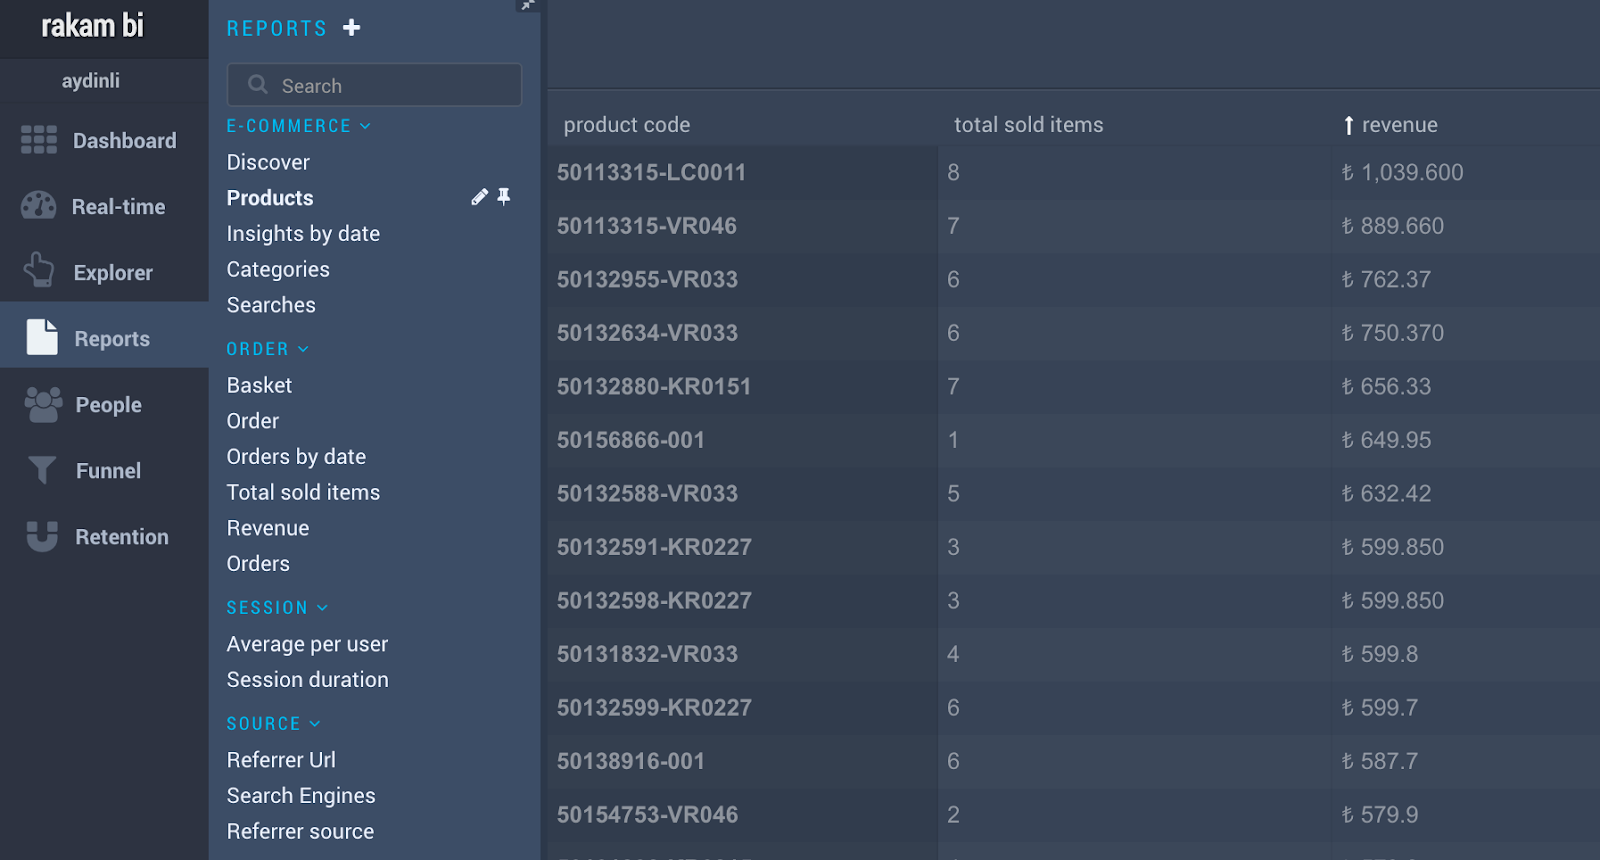
Reports
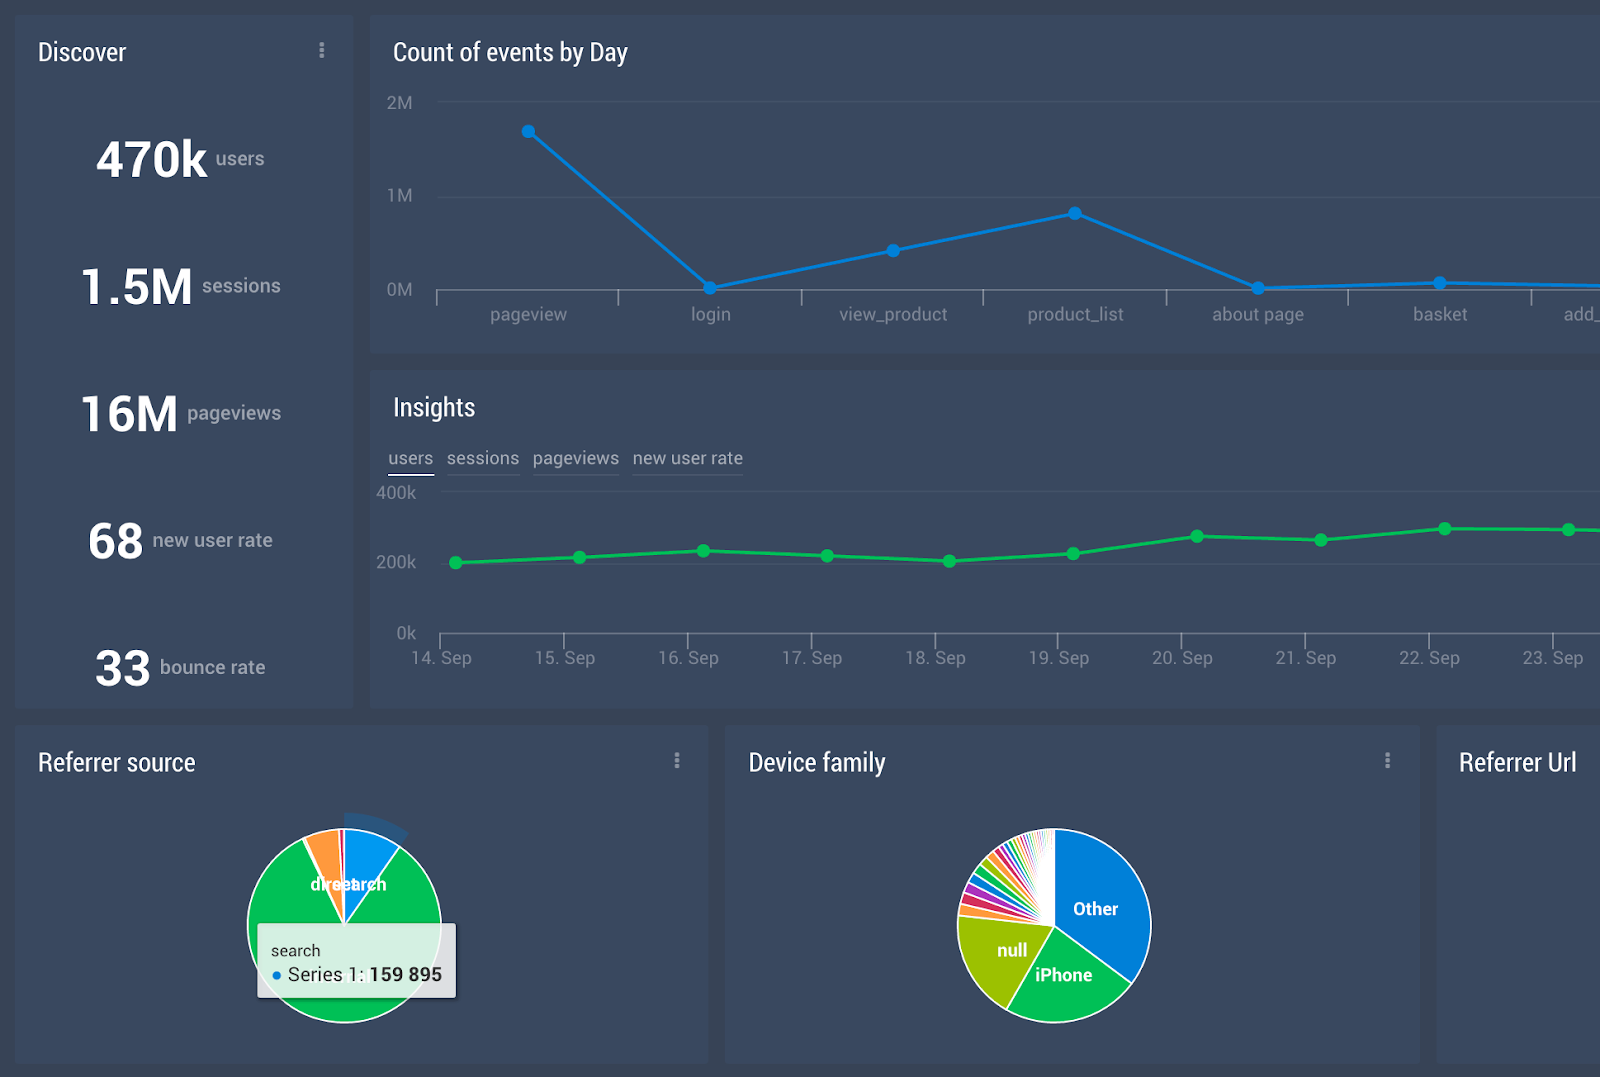
Counts of events by day
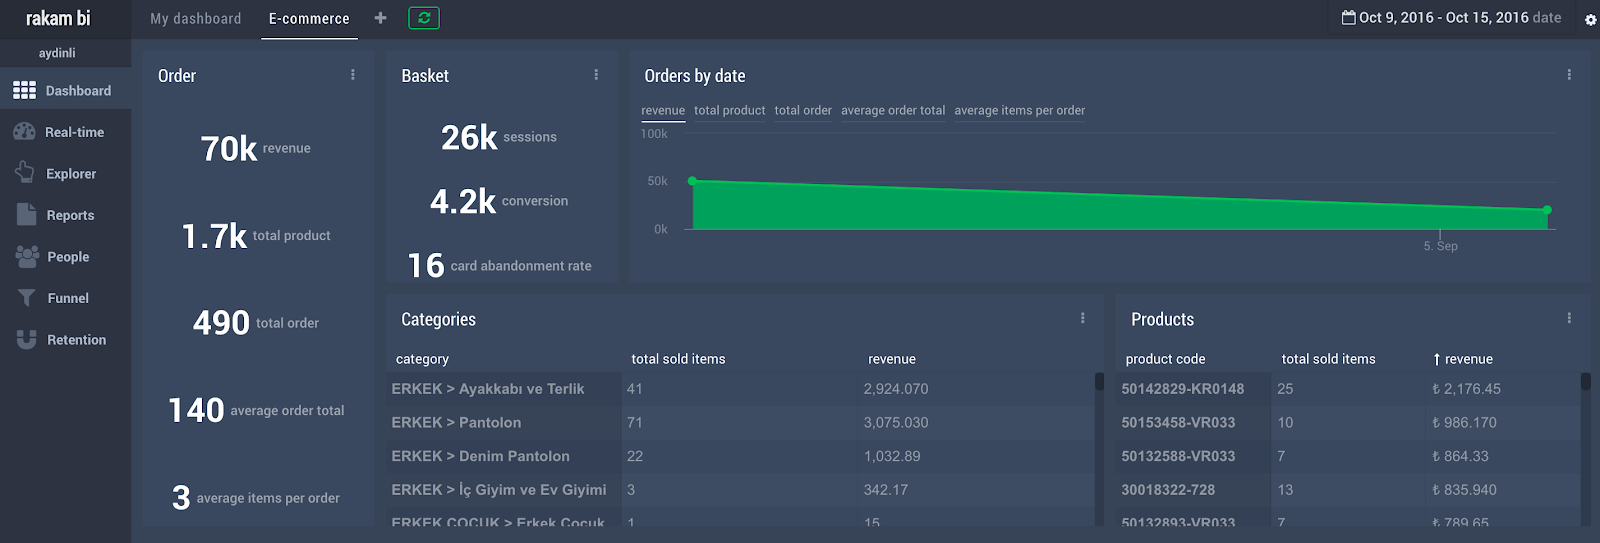
E-commerce Dashboard
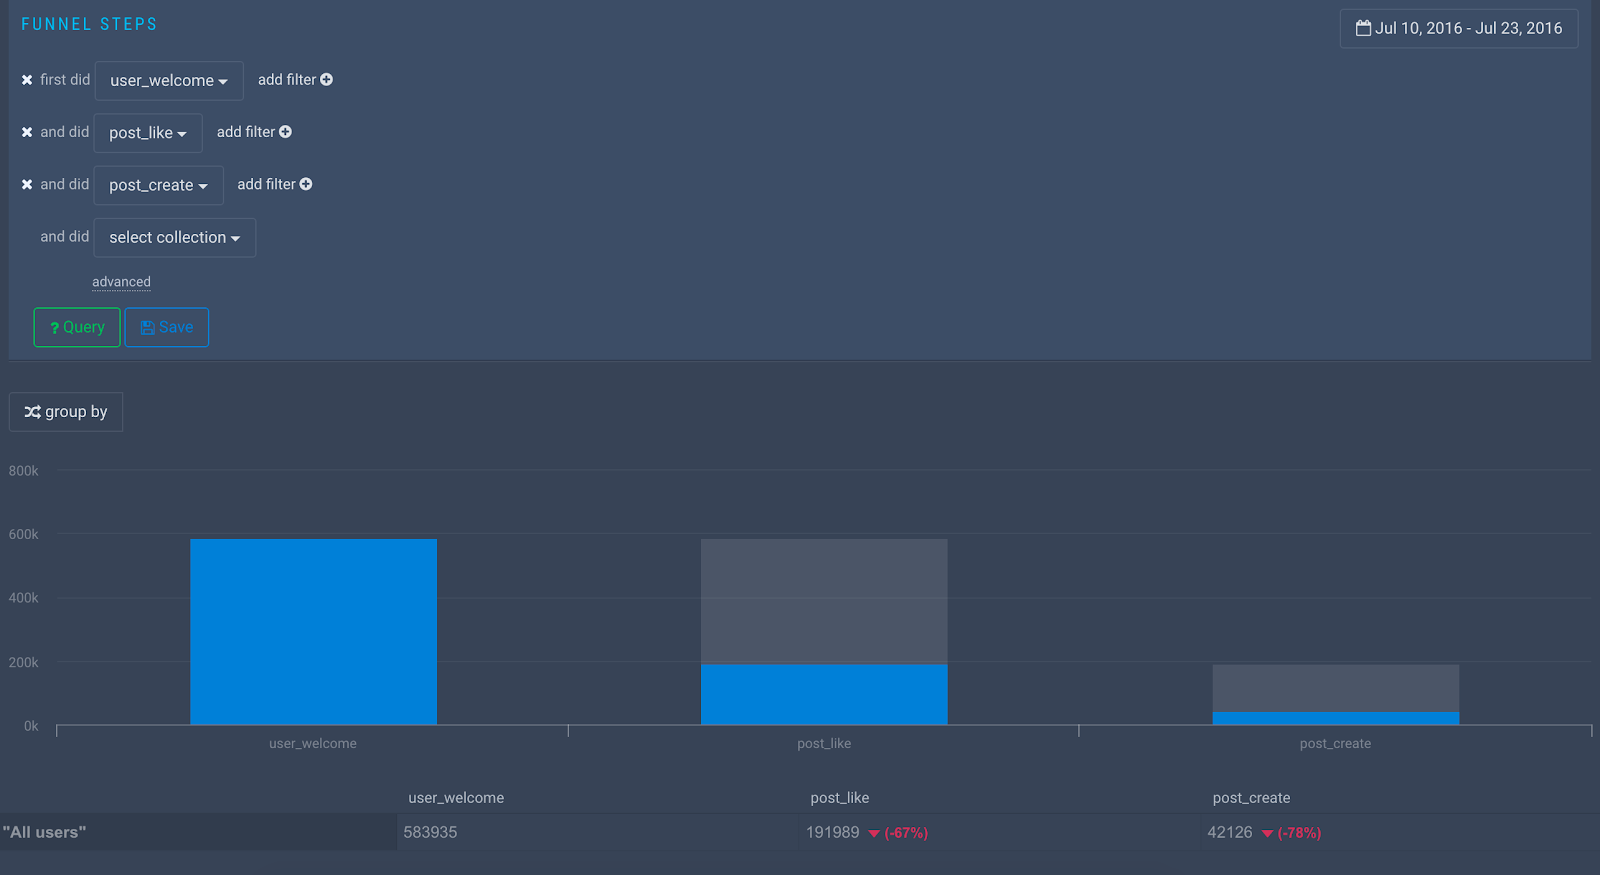
Funnel Reports
Event tracking is a must for any online store. With our web, iOS and Android javascript tracker, you are good to go.
Of course Google Analytics has some of the great features, but without control over your data, you are still going blind. Here’s a full comparison for Google analytics vs Rakam
Go ahead, give it a spin and see for yourself .