We Now Support Segment
We have been working hard to complete the Segment integration for our current and prospective customers, and now we are happy to announce that our integration with Segment is ready to rock n’ roll.
Segment is a great tool that allows you to gather your all company data into your data warehouse. You can connect your Facebook and Google account, integrate their SDK into your product, enable the third-party tools that you use for different purposes such as CRM, Hiring, and Payment and let Segment collect all the data into your database. Later on, you can use BI tools to analyze the data in your database.
Even though Segment removes the hassle of collecting the data, it doesn’t help when it comes to getting insights from the data unlike the analytics services such as Mixpanel and Amplitude. Instead, Segment suggests you use one of their BI partners. However; these BI tools such as Looker and Periscope are generic and usually don’t play well with the customer data. As a result, the product teams still prefer using product analytics tool such as Amplitude and Mixpanel to build funnel and cohort reports.
You can connect Rakam on top your Segment to do product analytics features such as Funnel and Retention, Segmentation for event metrics and SQL for complex reporting to get an understanding of user behavior. It gives your product teams the ability to create ad-hoc reports using the UI, and your data analysts don’t need to write SQL queries for funnel reports anymore!
Moreover, we created most useful metrics such as customer acquisition cost (CAC), customer lifetime value (LTV), revenue metrics such as monthly recurring revenue (MRR), you can easily drill-down the metrics and compare the performances of your marketing channels.
Please note that all the event types that we have shown below are the event types that you use in Segment.
Funnel
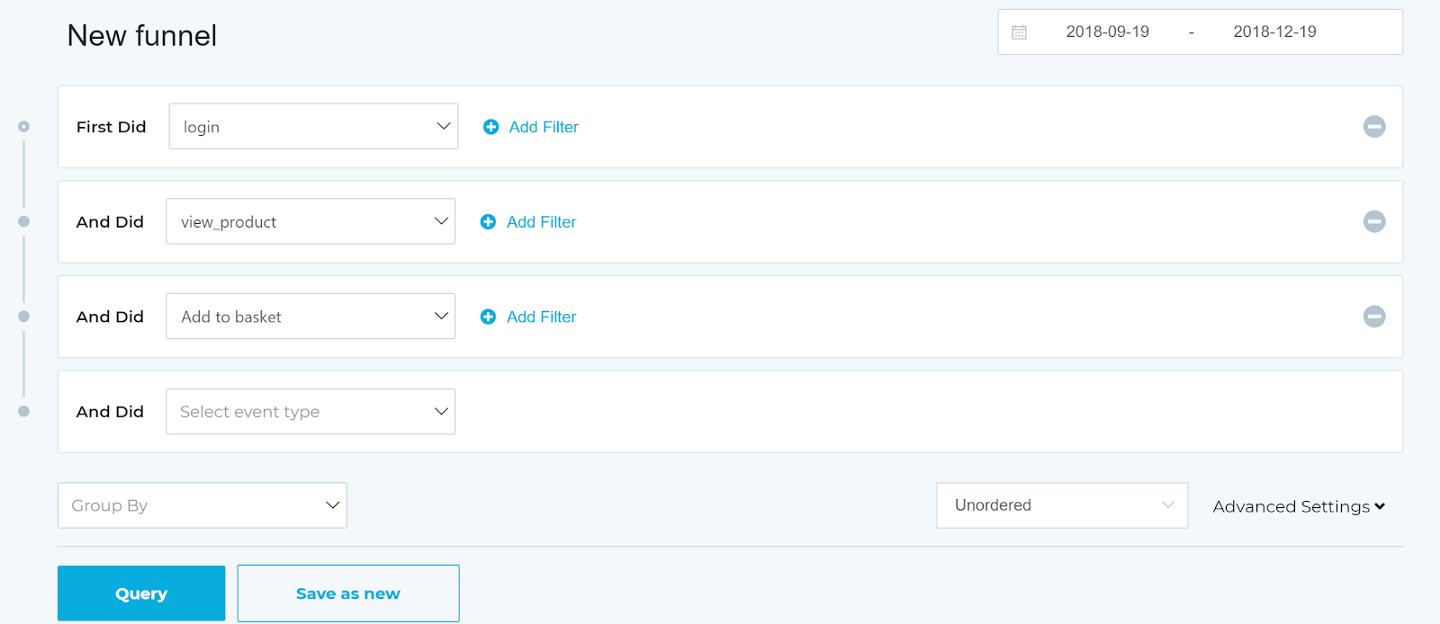
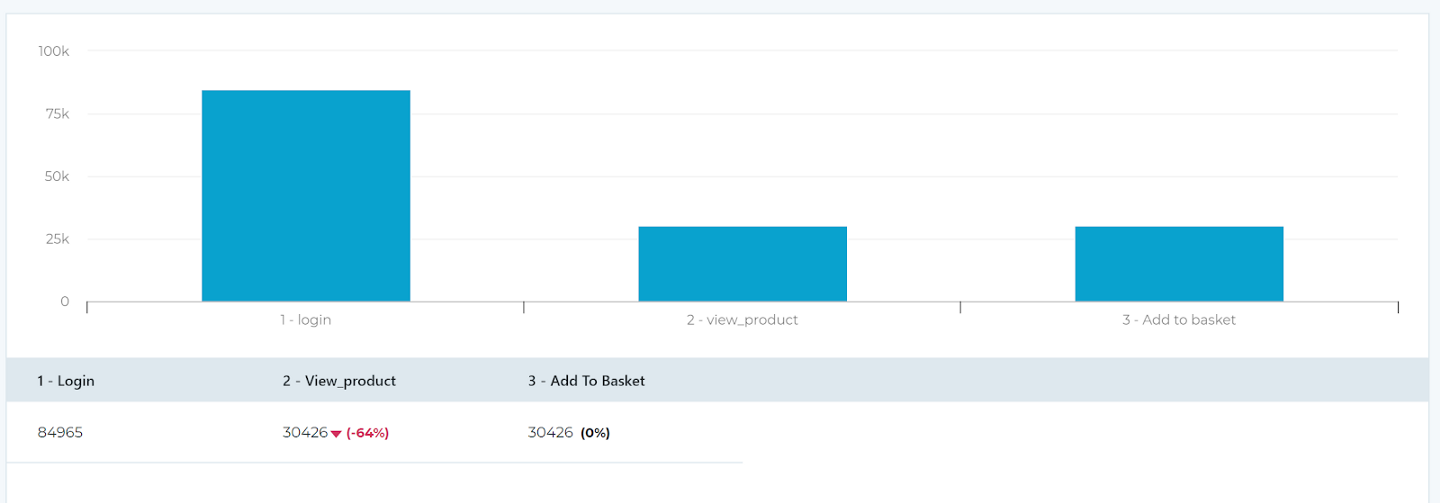
In the funnel, you choose the steps you want to have in your funnel. By clicking on the “First Did” you can choose your event type. Once you choose your first event type, “And Did” will be unlocked from here you can choose your following event type for your funnel.
Retention
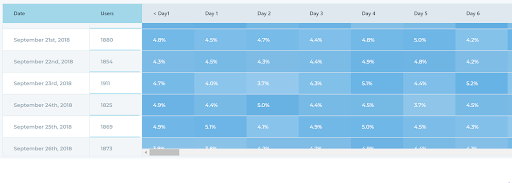
In retention, you have the “First Event” and “Return Event”. Your first event is “User who did” and return event is “Then come back and did”. After you select your events, you can choose to analyze retention data daily, weekly or monthly. Once select your preferred time period you can click on the “Query” button.
Segmentation
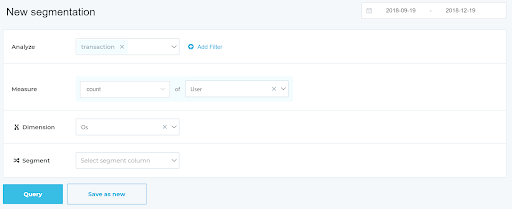
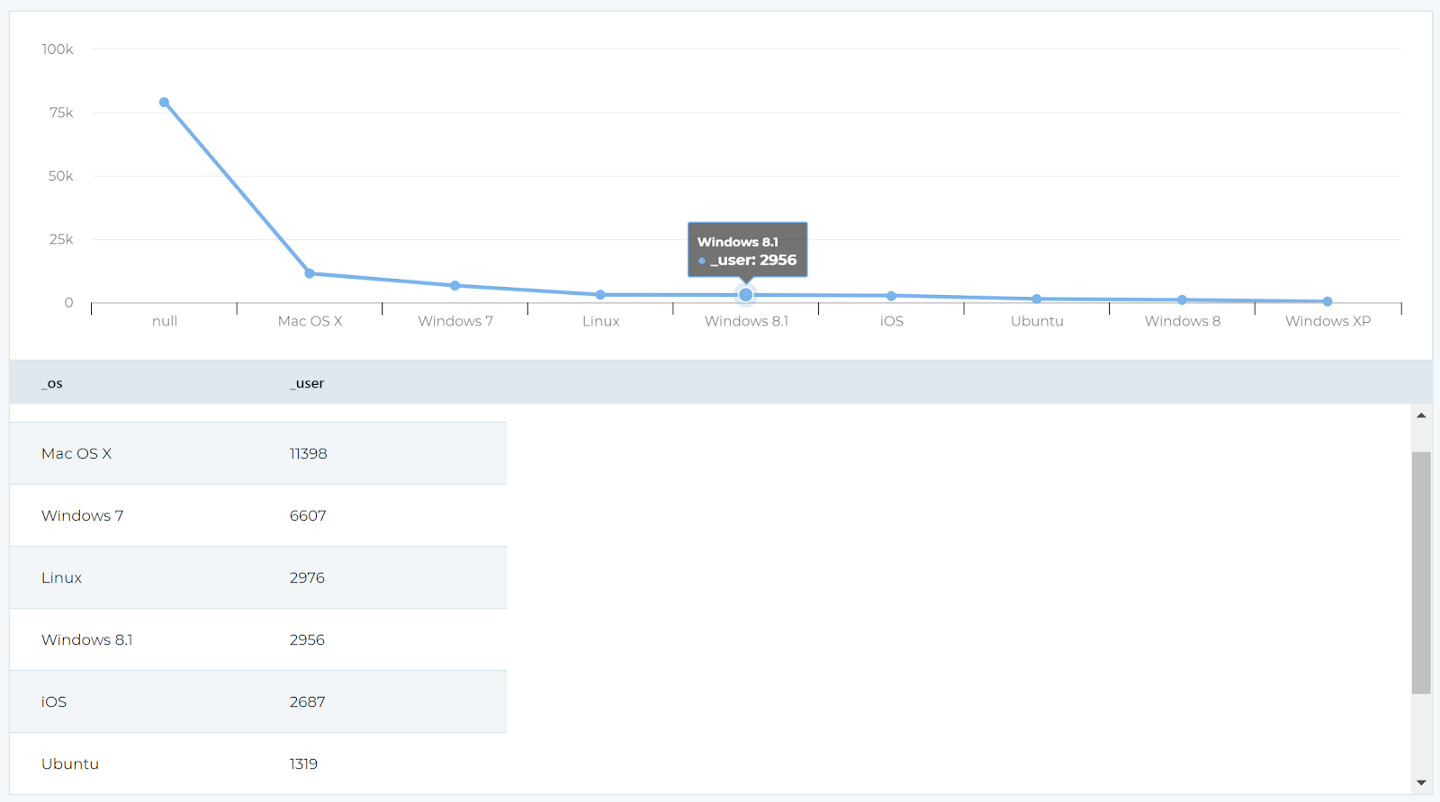
In the example below, we tried to segment users who did transaction by their Operating System. From the “Analyze” tab we picked the transaction, and we picked the user from the “Measure” and selected the Os from the “Dimension”. From the top right corner date is set to last three months, and now we can press the “Query” button to create our report.
You can see below the example segmentation chart just like in the funnel and retention you can press to the “Save as new” to save your report and share with your team.
