How to do Funnel Analysis with Rakam?
We have started to come across with quite a few people who are interested with Rakam and metrics we offer.But many among these are unaware of the features we offer, so in this post I will be talking about a very useful feature for analysing your users behaviour.
Today I would like to introduce you to the term *Funnel Analysis.*
What Is Funnel Analysis?
Funnel is a well structured flow of actions on your website. For example actions like, visit site, registration, execute search, add to basket. In short we can define funnel analysis as, the actions your users take before reaching the goal you designed, at the end of the funnel.This feature helps in understanding at what point of a certain process yours users abandoned the process and churned.
How To Do Funnel Analysis on Rakam?
In Rakam, we brag about how me make analysing event data easy for you and your team. Now I explain how we do that but explaining you how to actually do a funnel analysis in our platform.
So the first step is to define your funnel and than define what steps you would like to include in your analysis.We recommend to have 5–10 steps. If you have less steps than the recommended range above than you don’t have a funnel.
Lets make a funnel with using Rakam, so in this example we will use 6 steps to define our funnel. *register -> login -> product_view -> add_to_basket -> transaction -> product_rate.* We picked e-commerce industry as an example but these steps can be changed depending on your business.
As you can see in the picture below, we chose the steps for our funnel by using our drag down feature, no coding required just picked the steps we would like to add from list.
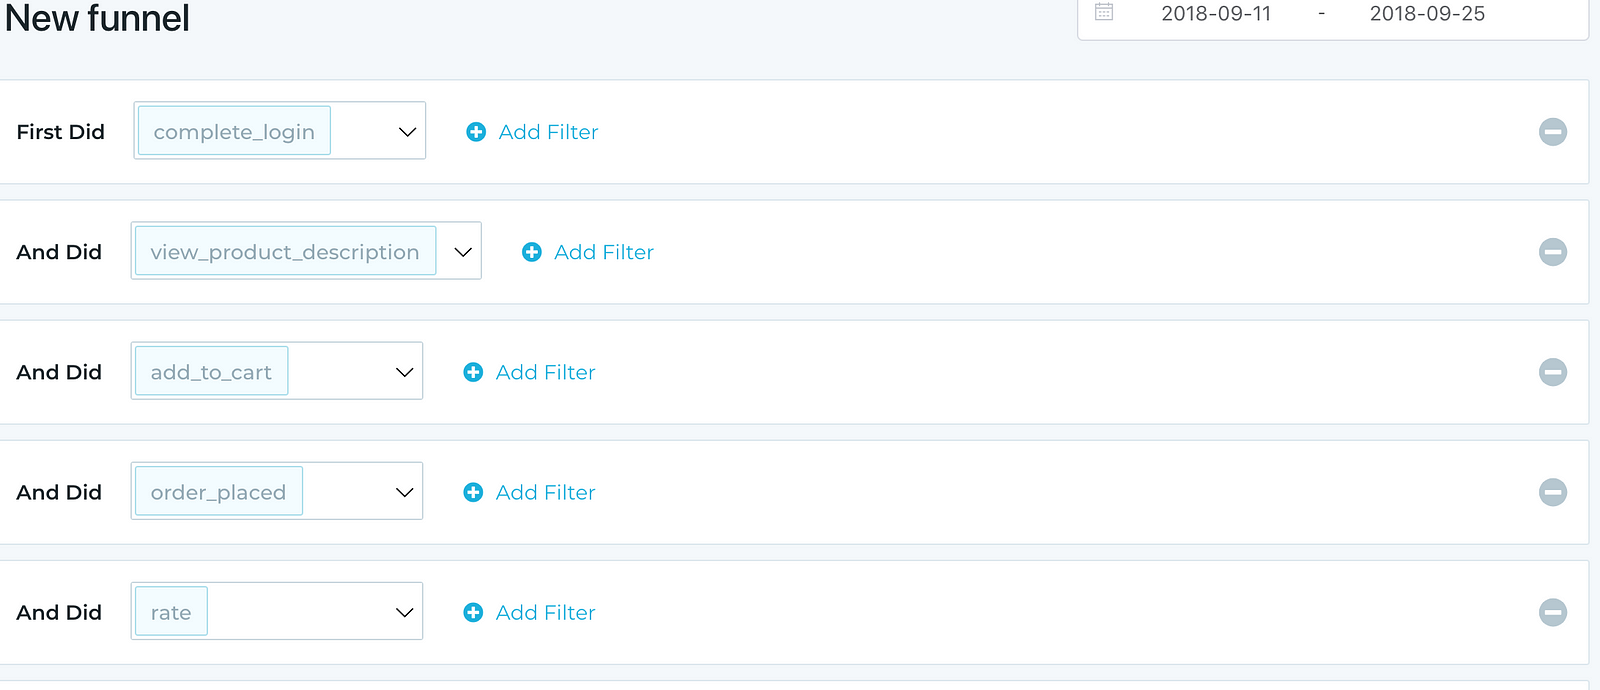
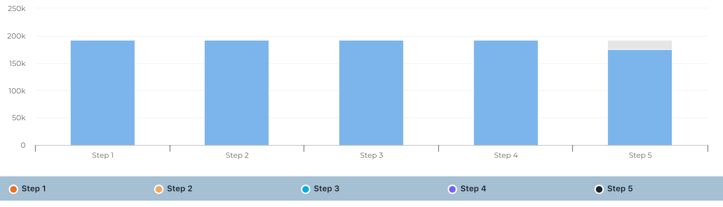
After picking our steps from the list, you simply click on that big shiny “query’’ button and kaboom!! you will have your chart right away. We tried to make our UI, *non-technical background friendly* as possible so that product teams can use it smoothly.
What Are The Benefits Of Using Funnel Analysis?
It is really vital to understand why you do funnel analysis and how you and your team can use this feature to get more insights on your customers. The most important insight you can get from the chart is the step where numbers drop the most. In other words where our users exits in the current process and churn. Obviously there are some steps, where we expect number of users to drop and its normal but the important thing here is to understand, how big is this drop compared with our expectations.
Let me explain what I mean so you can get a clearer picture. Let’s say that we are expecting 40% of our customers to drop during the checkout phase, which is normal and expected based on our analysis for the sake of argument. But we see a significant drop of 60% in checkout phase. That’s when *Mr.Decision maker* is going to say, wow what is going on, this drop is bigger than expected, either Rakam is not giving me accurate number (trust me not a good excuse numbers don’t lie) or there is something wrong in the checkout step.There actually is something wrong at this point and this is called “bottle-neck-point”. Doing Funnel Analysis helps your team to understand and find these points where users drop significantly more relative to your *expectations.* In the example I have given above, relatively higher drop in checkout page could be caused by issues like payment methods, maybe your company doesn’t allow payment methods that can be used by everyone or maybe you have some hidden fees (high shipping cost) that becomes visible during the checkout phase, there could be many more reasons to this, by doing funnel analysis we point you to the right direction and its up to you find the hidden gem there and solve the puzzle.
We recently launched a new UI and our users love it. You can read more about it here.
I’ve also put together a Getting Started video which will guide you through the setup process.
Feel free to Sign Up and try the New UI. We hear it’s awesome!
Let us know what you think!