Product Analytics: Why It’s Important and Not Suitable For Today's BI
We heard many times people asking the difference between BI and product analytics tools and whether they should use one another or both to answer the data-related questions within their company. We teamed up with Sarah Krasnik from dbt’s slack community here to talk about the major differences and why you might need both tools’ sets of features in your company.
Imagine this: you launch a new product feature, so the natural next step is to understand how the feature is performing. If your app or website has event tracking implemented (we explain this in more detail later) using a tool like Segment, Amplitude, or Mixpanel, you have the building blocks to track conversion between steps in the user experience. This type of information can be an excellent indicator of key drop-off points in the user funnel.
So, how do we make the events we’ve gathered actionable? Aren’t BI tools not meant for event-based data? Well, let me explain.
Prerequisite: event instrumentation

Let’s define what we mean by event instrumentation, tracking, and/or orchestration. On a webpage or within an app, tools mentioned above (Segment, Amplitude, Mixpanel) can be instrumented to fire events upon user behaviors like page views or button clicks.
Getting event tracking to be implemented reliably and accurately is a feat in itself. Once that instrumentation is in place, analyzing user behavior to better your product is a matter of having the right tool to gain actionable insights. A few terms that are usually coupled with event tracking are a “user funnel” and “user retention”.
Key take-away: “funnel analysis” and “retention” are more than just buzz words.
Taking e-commerce as an example, users cart items continuing to the payments page, and then never check out? Maybe the existing payment system isn’t meeting customer needs. In the financial world, are users starting applications for a loan but not continuing past the page prompting them to enter their social security number? There could be a lack of trust in the institution.
I hope I’ve convinced you there are meaningful insights to be taken from funnel conversion, which begs the question: how can we actually gain these insights from event-based data?
Building funnel and retention analyses
You’d likely want to know what stages were not reached by a user in the product flow to indicate drop-off points, or the largest opportunity to improve conversion. This in essence is funnel analysis, which if measured at the user level paints a vivid picture of user behavior.
Furthermore, looking at the time in which a product retains users and they come back to take a certain action influences larger business metrics like CAC (Customer Acquisition Cost) and customer lifetime value. Retaining users could also mean at what rate they come back to the product after initially signing up for it, colloquially known as “stickiness”. More formally, this is retention and also most valuable when events are aggregated to the user level.
For both funnel and retention analysis, to illustrate further–you likely don’t care about how many times a user re-loaded a page or visited a page within a 5 minute time frame (well, this could indicate a high error rate which is a completely separate metric). A user visiting a page more times within a short period of time doesn’t necessarily indicate a more successful product. However, a higher number of users visiting a page almost always indicates a better product, indicating an absolute need for aggregation to assess product viability.
No event tool mentioned aggregates events; that is left to the customer of the tool. In today’s ELT world, the event data is loaded directly into the data warehouse where the key user level aggregations occur.
We’re talking about taking hundreds of thousands (or even millions!) of disparate events to be aggregated into an easily understandable flow report. One approach is for an analyst to write a query to aggregate the events for the particular business unit and load the report into a traditional BI tool which would take thousands of lines of SQL already. However, what if a slightly different pivoting of the event data is required? The analyst has to create a new report due to the simple drill-down limitations of the BI tool. What if a different business unit also requires reporting on the event data but for a slightly different event subset? Similarly, the analyst must create a new report. This is not sustainable.
Well, we could load the event data directly into the BI tool, right? Once event instrumentation takes off, the number of events skyrocket. This means the taxonomy of events is extremely complex and needs its own data modeling approach. I can’t even begin to think about how a regular BI tool like Looker or Tableau could even first, aggregate events to the user level and then perform another aggregation over time. Let alone model complex event architectures.
A natural next approach could be creating reports in the event tool (Mixpanel, Amplitude) itself. However, if both Mixpanel and a BI tool are used for different use cases, two different modeling layers would have to be built for each tool no matter how comparable they are. If all the data is in the data warehouse, the best practice approach is to keep the data warehouse as the source of truth to decrease data and definition duplication.
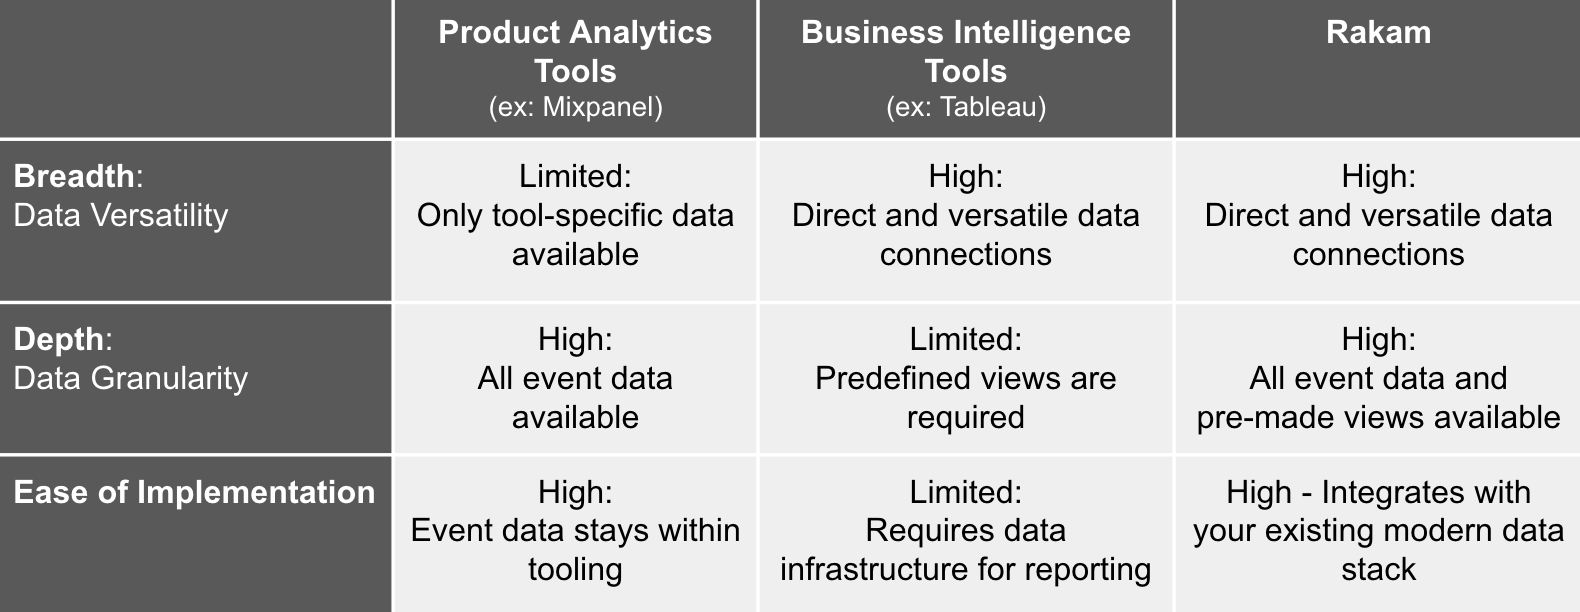
So what then? Is there any better approach than sending your data out to third-party tools to analyze event-based data? How about a tool that can understand event-based data and provide built-in features like product analytics tools while reading the data from your data warehouse directly just like a BI tool?
Rakam: delivering event comparisons with ease
Analyzing event data isn’t easy, but becomes much easier with a tool that allows you to look at all event data in one place with pre-built reporting. In other words, what you need is a verticalized BI for event-based data. Rakam allows you to look at the performance of users crossing different barriers in the product, captured by events in an easy-to-understand visualization.
We’ll explore the Segment integration to illustrate how to perform different types of analyses. In Rakam, all the Segment event attributes are easily imported once the integration is set up. The event attributes can be used throughout the different reports and combined with data from other sources.
Navigating to the Funnel tab in Rakam allows the end-user to select custom events from the Segment integration, in an order, and visualize the percent of users that traverse from one event to the next in their lifecycle in the product. The resulting visualization is filterable across any Segment event data like device type or user attributes.

On the other hand, the Retention view focuses on conversion between two very specific events over time. This type of view between two events could help a product team understand how a product change or new product launch influenced the targeted conversion at the point of interest.

Built for a variety of different tools, Rakam is highly configurable to several different input sources for event and user marketing data. It’s a warehouse-native verticalized BI tool that integrates with your existing stack and has supported event-based visualizations for marketing and product data.
We encourage you to visit Rakam’s demo and try out the tool for yourself!