What Is Product Analytics And Why Do You Need It?
Today the term of Product Analytics is not a well-known word in the industry. Let me enlighten you on this subject. Also, I will try to give you a better insight into how and when to use product analytics.
Product Analytics
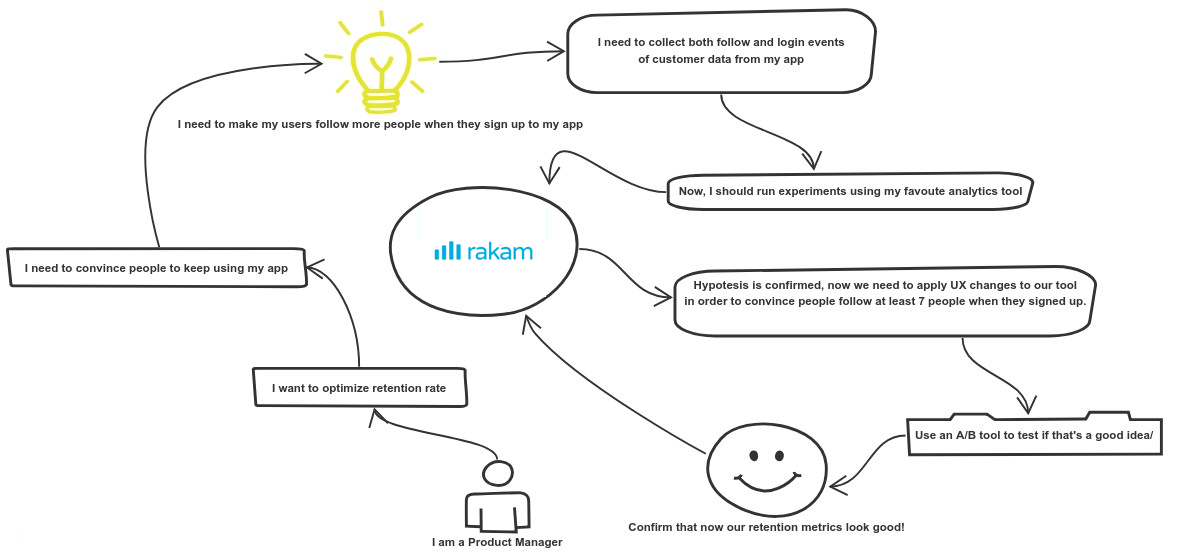
In simple words, analytics that allows you to understand how your users behave while using your product is Product Analytics. This works best with digital products as it is easier to track and analyze customer event data with digital footprints. Analyzing your customers’ behavior can lead to finding why your customers are churning, converting or coming back to your product.

What Industries Benefit Most From Product Analytics?
In my previous article, I introduced the industries that benefit most from analytics. Companies which has a mobile or web application can benefit the most from utilizing product analytics. Data-driven companies are dependent on consumer behavior. For a better understanding of user behavior, conducting analyses such as funnel, retention and segmentation is a must. Insights gathered by these analyses could be used to provide a better experience for your users that will retain and convert more users over time. Having data on user-level can help companies to have an advantage in today’s competitive business environment. From our customers, we’ve learned that they’ve achieved an increased return on their profits by tracking every user actions. To see these returns, one needs to have an understanding of product analytics and use it efficiently.
What Can You Get From Product Analytics?
Product analytics is often confused with marketing analytics. But unlike marketing analytics, product analytics is focused on user actions on your product rather than click-through rates on a marketing channel that you don’t have control of the product. It allows you to track and analyze your users’ events to make your product better. Data gathered from using product analytics features is used by product managers, growth managers and UX designers to make improvements on their products.
By using Product Analytics you can ask questions like;
√ What can we do to reduce the churn?
√ Where is the bottleneck point in our sales funnel?
√ What percent of our users return to our app after initial usage?
√ What characteristics do our most loyal customers have in common?
√ How many of our users are completing a key event for our company?
√ Which feature gets the most usage?
What Are The Most Commonly Used Report Types?
There are 3 most commonly used reports to answer these important questions about user behavior. These are funnel, retention and segmentation.
Funnel
A well-structured flow of actions on your website is very important to have a complete view of what your users are actually doing on your product before completing the goal you set. These actions can be anything from session start to sing up or add to basket to purchase completed. Funnels help you understand at which step what percentage of your users dropped off or converted.
Here you can see a simple funnel analysis I’ve designed:
First step(blue): Application open
Second step(green): Add to basked
Third step(orange): Purchase complete

Retention
Retention is one of the most powerful reporting types. That helps you understand how often your users return to your app/website. Retention analyses are created by selecting two events as first event and second (returning) event. You can use retention reporting to understand which features driving your users back most while some might be doing the opposite.
Here is a simple retention report for an app:
First event: Sign up
Second event: Notification Open

Segmentation
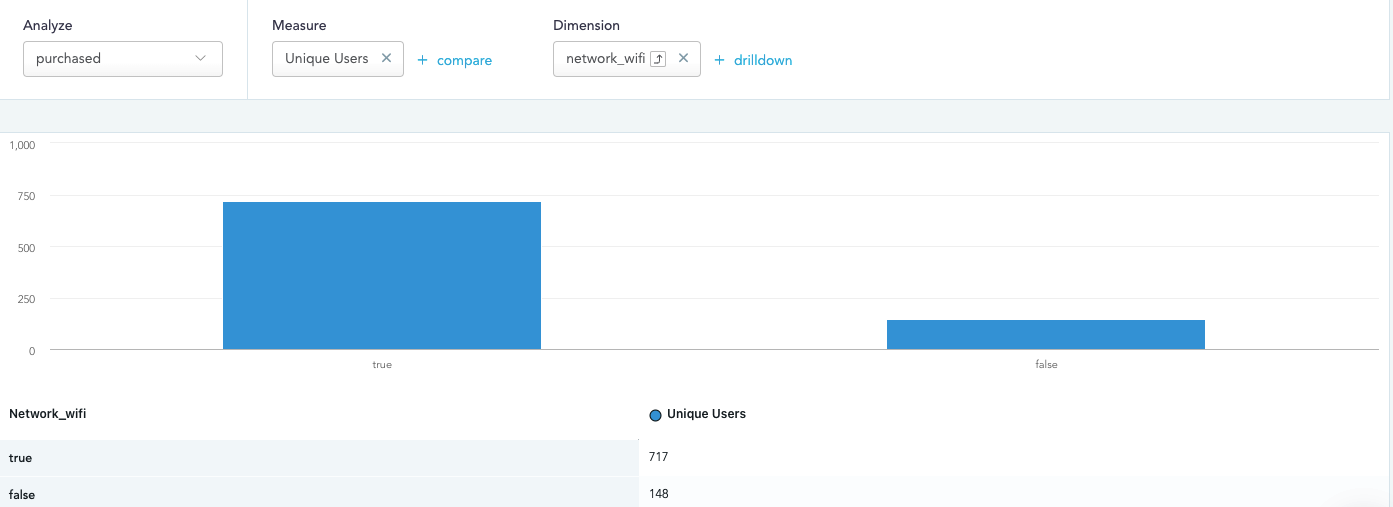
By using segmentation reporting, you can discover hidden gems in your data and get useful insights such as the common characteristics of your best customers. Using this reporting will allow you to get detailed segmentation of your user-level data. For example, you can segment your best customers to see what characteristics they share in common and create a second segmentation that includes the users who have those specific characteristics so you can target them with an email or social media campaign. For example, your power users might be all from San Francisco, there you go! You found where you need to target with ads to acquire more power users.
Here is a segmentation report where I discovered that users on Wifi are more likely to complete a purchase event on my app:

Summary
I hope that this has article has given you some understanding of why and when we use product analytics. Every business can see a benefit from using it. Whether you want to keep your users more engaged in your app or run well-targeted marketing campaigns to acquire new users, the first step is to get to know your users and understand how and why they are using your product.
If you have not used product analytics features before it could take some time to learn and adapt to it. Take your time and try to put yourself into your customer’s shoes to be able to ask the right questions to your data.
If you’re wondering what tool I’ve used to create these reports, check out Rakam. Feel free to drop us a message if you have any questions or don’t know where to start.
